Thank you! Your submission has been received!
Oops! Something went wrong while submitting the form.

"PiinPoint has become an integral part of my role as Retail Analyst at Cushman & Wakefield Waterloo Region. The platform allows me to put together professional looking reports and provide clients with the insights they need to make real estate decisions.
I honestly don’t know how I would do my job effectively without PiinPoint."
Jessica McCabe, M.Ed.
Retail Analyst
Last updated: September 2021
Fresh-casual eateries are one of those everlasting brick and mortar tenants in an age of retail evolution. Alongside concepts like healthcare services, fitness chains, and personal amenities, these eateries continue to experience traditional growth trajectories as consumers consistently go out to eat or order ready-made meals, even in the age of COVID-19.
Many food and beverage chains that originated as hip local restaurants, have succeeded in becoming household names across the US and Canada. Sweetgreen, Wahlburgers, BurgerFi, and Chipotle would be some, just to name a few. These brands are opening up to 200 units each year and occupying real estate at an increasing rate. While not all can pull off such staggering growth, many manage to do 10, 15, 25 units annually.
At the same time, tried and true restaurant concepts with an “older” and more established physical footprint are seeking network changes; through integrated omnichannel strategies, experimenting with new store formats (e.g. Ghost Kitchen and Fool Hall concepts), and re-imaginging what their real estate spaces can do. With industry trends like consumers demanding local products and experiences, retail needing to up their ESG game and “do what’s right” for their communities, and increasingly diverse markets, F&B concepts are proving that even against all odds, they can adapt and have spectacular growth and franchising opportunities.
As growing concepts look to scale, a major challenge becomes knowing where to go next. Once the obvious markets that represent more of a “low-hanging fruit” are tackled, then what?
Many restaurant concepts quickly develop a regional or national presence, yet are not fully optimized in each geography, and need to prioritize what new markets to grow into.
Making an uninformed decision on whether a city is a single or multi-unit market can leave money on the table if more than one opportunity exists. Knowing which markets you can infill and leverage your established brand in is key. And determining which geographies make sense to grow into should be based on more than simply franchisee interest.
Restaurateurs often rely on the local know-how of a franchisee or a broker network to gauge where the best locations are. However, without careful decision-making, opportunities can be miscalculated, markets oversaturated, or franchise territories made too big.
Location intelligence can be applied to optimize for growth and success, and de-risk the bias that many businesses are tempted to follow when making location-based decisions.
A growing concern with the use of big data and analytics is the trustworthiness and visibility into the methodologies applied in analytical projects. Successful analytics requires impartiality, careful scrutiny, as well as a solution that builds transparency and trust for the end user.
PiinPoint’s Marketmatch helps fast-growing restaurateurs understand two key things:

PiinPoint Marketmatch can take the form of a qualitative exercise with a brand’s Real Estate leadership called Marketmatch Lite, or a statistically derived assessment, Regular Marketmatch:
Scorecards are driven by criteria selected by the user. In order to do this, PiinPoint requires engagement from key leadership and stakeholder groups to draw conclusions on what factors most impact success.
These factors are then carefully crafted into a site selection scorecard and an easy to use, integrated roadmap in PiinPoint.
Scorecards are derived from an analytical assessment drawing from Client data, PiinPoint data, and advanced statistical methodology. Outputs are integrated into the PiinPoint platform.
PiinPoint works with its clients to ensure the scientific framework is artfully combined with their expertise to fit the brand context.
This whitepaper expands on how PiinPoint helps growing restaurateurs better understand their network’s performance indicators, and where to find those factors going forward. By looking at a sample concept called Keto Cafe, we demonstrate the methodology used in our Marketmatch offering and the insights it provides to our clients.
NOTE: Please note that this is a hypothetical study: the restaurant concept, real estate selected, sales performance, and Marketmatch profile / scorecard results are all simply for demonstrative purposes.
PiinPoint Marketmatch sheds light on what’s happening across a location network, and outlines a roadmap for success as retailers like the Keto Cafe grow. Marketmatch will help to provide insight into decisions regarding real estate, franchising, marketing, and operations, including:
Growth no longer becomes a guessing game, there is a game plan on the best markets to expand to, and why.
Data has been pulled to identify customer groups that are most impactful to the retailer’s success. This can be used in marketing and advertisements that target the ideal customer.
For those markets that are highly suitable, but host poor performing locations, that’s a great indicator for the restaurateur to take a closer look at the store in more detail. It could be there are operational issues that need to be addressed - from staffing concerns or having the right hours of operations.
Where both store performance is low, and market potential is low, Marketmatch helps you identify what existing locations should be considered for closure or consolidation, due to poor performance potential.

Founded in 2012, the Keto Cafe has been quickly growing as the ketogenic diet trend has become increasingly popular throughout North America. It serves fresh, ketogenic food that is made on-site, including salads, entrees, and bakery products. It also specializes in ready-made meals, which are great for customers to order online and pickup, or have delivered to their homes.
The Keto Cafe has 201 locations across the US and Canada, and plans to open an additional 20 franchise units in the coming year. Stores are mostly spread throughout urban markets in both countires, including in the US; Texas, Arizona, California, Illinois, Georgia, Colorado, Seattle, and Virginia, and in Canada; the Greater Toronto area, Vancouver, Calgary, Edmonton, Montreal, and Ottawa.

Any good statistics require a strong sample size.
In order to develop a Regular Marketmatch roadmap, PiinPoint requires a strong network sample size. The more data points to assess, the better. Without a strong sample set, it’s hard to confidently determine whether dynamics that are occurring across a store network are significant. Keto Cafe has a network of 201 stores, lending a significant amount of historical data points to work with.
*PiinPoint Marketmatch can be tailored to also support smaller chains. To learn more, regardless of your network size, contact us sales@piinpoint.com.


To understand what’s going on across the network, stores are assembled into groups to determine commonalities based on performance. For this study on the Keto Cafe with 201 locations, we’ve taken two groups with the top fifteen performing sites versus the bottom fifteen performing sites.
For the Keto Cafe, we used a simple performance metric of the previous year’s sales.
Additional years’ historical sales can be applied, or other metrics can be compared for the performance grouping. Some examples of this have included operational factors, no. of customers, market capture, and so on.
Normalizing the Data
PiinPoint creates opportunities to leverage the client’s expertise throughout the development of a Marketmatch solution to ensure that they trust the methodology being used.
The brands’ expert knowledge is considered at this point to normalize performance where necessary. To the restaurateur, those IDs are not random stores, they represent real-life scenarios that are either desirable to replicate, or not. Some sites may have experienced an abnormal year of sales due to external factors like road construction, renovations etc., all of which need to be considered.
Store closures due to COVID-19 can also be considered here. In some cases, performance data from pre-COVID versus post-COVID may be more or less applicable.
Creating a Profile
After creating performance groups for the Keto Cafe, we begin developing the Customer Profile. At the heart of the Keto Cafe’s Customer Profile is an in-depth understanding of their trade area. Understanding the trade area helps concepts like the Keto Cafe to understand:
The trade areas used in Marketmatch can be determined in a few different ways:
Ideally, the trade area is created with customer data. This makes the difference between PiinPoint crafting a Location Profile versus a Customer Profile.

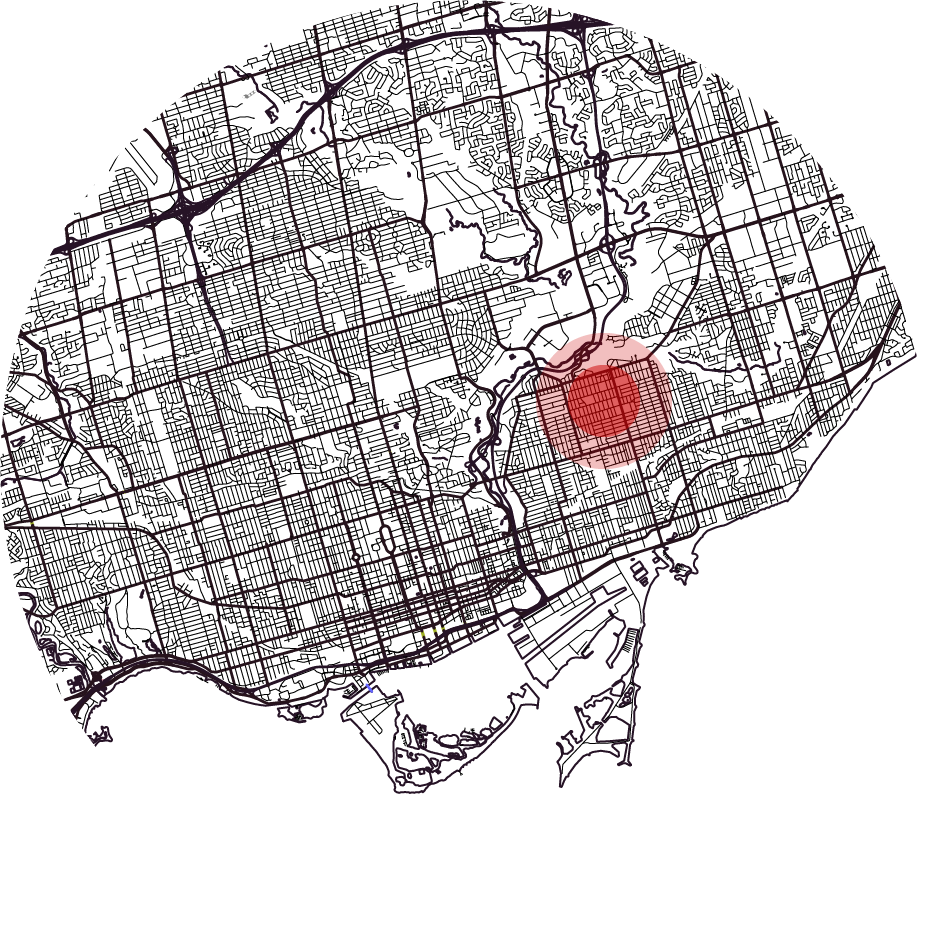
A location profile describes what is happening around a location, by a given trade area distance. Location profiles assume that generally anyone within that distance to the store could be a customer.
Image 1. The ring is used to understand customer characteristics.

A customer profile is more in-depth than a location profile. It describes what is happening where customers exist around a location. Rather than assuming all people living within 1 mile of the store are customers, it studies the areas where there are pockets of customers.
Image 2. The pockets are used to delineate customer characteristics.
The Keto Cafe has a best-in-class customer rewards program, which collects zip code data from customers. They also conduct bi-weekly, in store surveys to gather zip code data. What is most compelling is that the data they can collect from their delivery program includes delivery addresses.

All of this was observed by PiinPoint to determine that the trade area size for a Keto Cafe is a 7-minute drivetime.
Statistical Modelling
With performance groups and trade areas identified, PiinPoint conducts the Marketmatch analysis. We use a statistical model to identify what factors are statistically significant for the Keto Cafe’s performance groups, drawing from a sample of both high and low performers, and across a variety of different datasets. PiinPoint’s standard datasets include demographics, competition, anchors, and existing locations. Additional inputs can be added, such as segmentation data. For example, brands like the Keto Cafe, who wanted to better understand what kind of online conversations impacted their success, could also include geosocial segmentation data in their analysis.
Modelling Demographics
PiinPoint measures the impact of thousands of demographic variables to understand their relationship to the Keto Cafe’s performance groups. We only consider variables which are statistically significant. With these insights, Keto Cafe better understands what it takes for a high-performing market to succeed. To illustrate some of the dynamics at play, PiinPoint provides a summary on each of the major census topics.
Let’s take a look at the results.
Census Breakdowns
Population: Higher median age (with more 40 to 50 year olds), more married or common-law relationships, more couples with grown children, less divorced or separated individuals, smaller families or couple units, with higher population density.
Education: More trades educated or college educated. Typically educated in Arts and Humanities, social sciences, or science related fields, or trained in manufacturing, warehousing, and utilities.
Industry: More people employed in Finance and Insurance, Real Estate, or professional, scientific, and management industries, fewer people employed in Agriculture, Forestry, Mining or Fishing.
Transportation: Commute outside of city of residence, with longer commute times (that will not carpool), with more late leaving times, less likely to take public transit, or else only take public transit.
Ethnicity Descriptors: Strong European (western and northern) background representation, and Hispanic origins (Brazil, Chile, Peru), less third generation immigrants and more non-immigrants, more US citizens with place of birth in Americas or Europe, fewer visible minorities (especially West Asian, Arab, Chinese).
Economics: High rate of employment, middle to upper class household earnings, between $70,000 to $140,000. Mid to High home values and higher value renter market.
Household Characteristics: Smaller homes (fewer bedrooms), more condominiums, less suitable homes with more repair needs, smaller household size, fewer rented than owned dwellings, more and older household maintainers, fewer apartments, and fewer attached dwellings.
Demographic Insights
In summary, PiinPoint determined that the demographics for top performing locations could be described as follows. This profile is shortly compiled into a scorecard.
Older, middle-aged couples or individuals with older children, smaller households living in affluent areas with highly-valued homes, employed in white collar or highly-specialized blue collar occupations, and employed in professional services or finance.
Modelling Influencers
Every concept has an idea of what other brands, organizations, or places fit within its market. While Marketmatch can consider assumptions that the Keto Cafe came to PiinPoint with, like being near Trader Joe’s and Orangetheory Fitness, PiinPoint takes a scientific approach to determining what type of retail landscape they truly thrive in and how to consider that in their decision making.
Modelling Competition
If a brand has competitors, they also need to be considered as new markets are explored. For the Keto Cafe, it was important to see how the presence of trendy, fresh-casual brands like Tropical Smoothie Cafe, Corelife Eatery, Tender Greens, sweetgreens, Freshii, etc. had on their market success. Though close proximity to such competing concepts intuitively seems important to avoid, in some cases the presence of similar brands in a market can be a strong indicator that the clientele exist. If the market is undersaturated, competition becomes less relevant in decision making.
Modelling Cannibalization
Finally, proximity to one’s own stores is vital in planning markets and optimizing a network. For the Keto Cafe, in some markets there are multiple locations, in others, they are single site markets. It’s important to know how the dynamics of brand awareness and oversaturation come into play.
The Keto Cafe had a company mandate to protect their franchisees, meaning each store was always at least 2 miles away from each other. In other cases, understanding proximity of one’s own stores can have a major impact on market success, for example, drive-time capture rate between markets.
POI Insights
PiinPoint assessed a variety of competitors, anchors, and co-tenants for the Keto Cafe. It was identified that some concepts or categories are important to be closer to, or further from. Here is a correlative assessment for top competition, anchors, and Keto Cafe locations:

Scorecard Compilation
A struggle with having crafted narratives and summaries like those shown in Demographic or Retail landscape profiles, is that they can be difficult to directly translate into a strategy.
How do you apply demographic segmentation, customer behaviour, and important influencers to the map at scale? PiinPoint pulls the most significant criteria from Marketmatch into a scorecard for success. This scorecard can be directly translated into a real estate strategy in PiinPoint. For the Keto Cafe, we broke it down into two components: Demographics and POI Influencers.
The scorecard allows PiinPoint to produce an integrated set of Marketmatch Layers for the Keto Cafe in the PiinPoint app. Keto Cafe can use these layers in whatever geographies they explore, be it brand new markets or infill opportunities.
Every scored intersection, along major arterial road networks and within a population center, is ranked with a Marketmatch Score. This methodology ensures that scores provided represent legitimate markets for consideration where there are presumed retail and commercial real estate availability, i.e. not at a rural crossroads, within a suburb, National Park, etc.
These integrated Layers give the Keto Cafe Real Estate team a strategic roadmap for assessing new markets going forward.
Questions that Marketmatch answers:
Real Estate
What areas represent the best opportunities for me?
Where are the most suitable locations in X market?
How many opportunities are there for me in each market?
Operations & Store Planning
What stores are under-performing despite having strong market characteristics?
Marketing
How well is my ideal customer type represented in this area?
Finance
Which stores should we consider closing in this area to reduce costs?
Total Population: 641,494
Highest Marketmatch Score: 78.03
Lowest Marketmatch Score: 15.37
Portland is already a 3-store market for the Keto Cafe. However, our first layer shows us what the market looks like, assuming there were no existing Keto Cafe locations there. This helps retailers benchmark their existing locations against their ideal criteria.

The second layer shows the same market, but considers Marketmatch given the existing store network. In this scenario, opportunities shrink depending on the constraints that the Keto Cafe mandated for store proximity. Previously suitable opportunities become unsuitable.

Summary
However, even with three stores in this market, Keto Cafe can identify that there are additional opportunities to grow outside of the downtown core into the greater Portland neighbourhoods. These have excellent suitability, and include Beaverton, Hillsboro, Tigard, and Oregon City.
Additional opportunities were identified in net new markets across the United States and Canada as well, including Boulder, Cleveland, Cincinnati, Chicago, Atlanta, the greater Los Angeles area, and the Greater Toronto Area.
By conducting a Marketmatch study, we’ve shed light on what’s happening across the Keto Cafe’s network, and outlined a roadmap for success as they grow. Marketmatch has helped to provide insight into decisions regarding real estate, franchising, marketing, and operations, including;
Marketing: Knowledge on the Customer
Data has been pulled to identify customer groups that are most impactful to the Keto Cafe’s success. This can be used in marketing and advertisements that target the ideal customer.
Franchise Operations: Gaps in Performance
For those markets that are highly suitable, but host poor performing locations, that’s a great indicator for the restaurateur to take a closer look at the store in more detail. It could be there are operational issues that need to be addressed. On the flip side, those sites that are poor-performing AND located within a less suitable area represent opportunities to optimize the network; possibly relocating to more favourable conditions, negotiating reduced rents, or converting to a distribution-type store format.
Real Estate: Identifying Top Markets for Expansion
Growth no longer becomes a guessing game; there is a game plan on the best markets for which to expand, and why.


