No items found.

Contact Us

Thank you! Your submission has been received!
Oops! Something went wrong while submitting the form

Request a PiinPoint Demo

Fill out the information below and member of our team will walk you though our Location Intelligence platform and answer any of your questions.

We're committed to your privacy. PiinPoint uses the information you provide to us to contact you about our relevant products, services, news, tips and events. You can unsubscribe from these communications at any time. For more information, check out our Privacy Policy
Conestoga College

Conestoga College Students, you can access PiinPoint by visiting: https://app.piinpoint.com/sso/conestoga

Schedule your PiinPoint Demo Now!
Oops! Something went wrong while submitting the form

Contact Us!

By submitting this form, you agree to receive promotional messages from PiinPoint about our products and services. You can unsubscribe at any time by clicking on the link at the bottom of our emails.

Thank you

We will be in touch soon!
Oops! Something went wrong with our form.
Please send us an email at Info@PiinPoint.com and we will help you out.

"PiinPoint has become an integral part of my role as Retail Analyst at Cushman & Wakefield Waterloo Region. The platform allows me to put together professional looking reports and provide clients with the insights they need to make real estate decisions.

I honestly don’t know how I would do my job effectively without PiinPoint."

Jessica McCabe, M.Ed.
Retail Analyst

A map with a red dot on it.

Get a Demo!

Learn how our location intelligence platform will improve your expansion efforts.

By submitting you agree to our terms and conditions. A member of our team will contact you within 48hrs.
Thank you! Your submission has been received!
Oops! Something went wrong while submitting the form.

Download PDF

Check your email for your copy of the this report.
Oops! Something went wrong while submitting the form
PiinPoint
PiinPoint Logo
Login

The PiinPoint Guide to Visitor Reporting

INTRODUCTION

PiinPoint’s Location Intelligence platform uses Mobile Location Data (MLD) to help you learn more about visitors to any location, including when they visited, their demographic profile and the distance they travelled to your location. This paper offers an overview on PiinPoint’s geofencing and Visitor Reports product, digging into the methodology used to predict visit patterns and covering the most valuable insights they provide.

BACKGROUND

We have partnered with Near, a leading provider of anonymized MLD, to draw insights from over 45 million mobile devices across North America each month.

Piinpoint receives vast amounts of raw observation data on a daily basis through our partnership with Veraset. With monthly tables representing hundreds of TBs of data, this represents a significant sample of data that can be used for a myriad of purposes. PiinPoint applies MLD to our Location Intelligence platform through three primary channels:

1. AADT Traffic Count Estimates
2. Custom-Built Predictive Models (i.e. Sales Forecasting or Cannibalization)
3. Visitor Reports
AADT Traffic Count EstimatesCustom-Build Predictive Models. Example of Impacted Locations. Visitor Report

WHAT ARE VISITOR REPORTS?

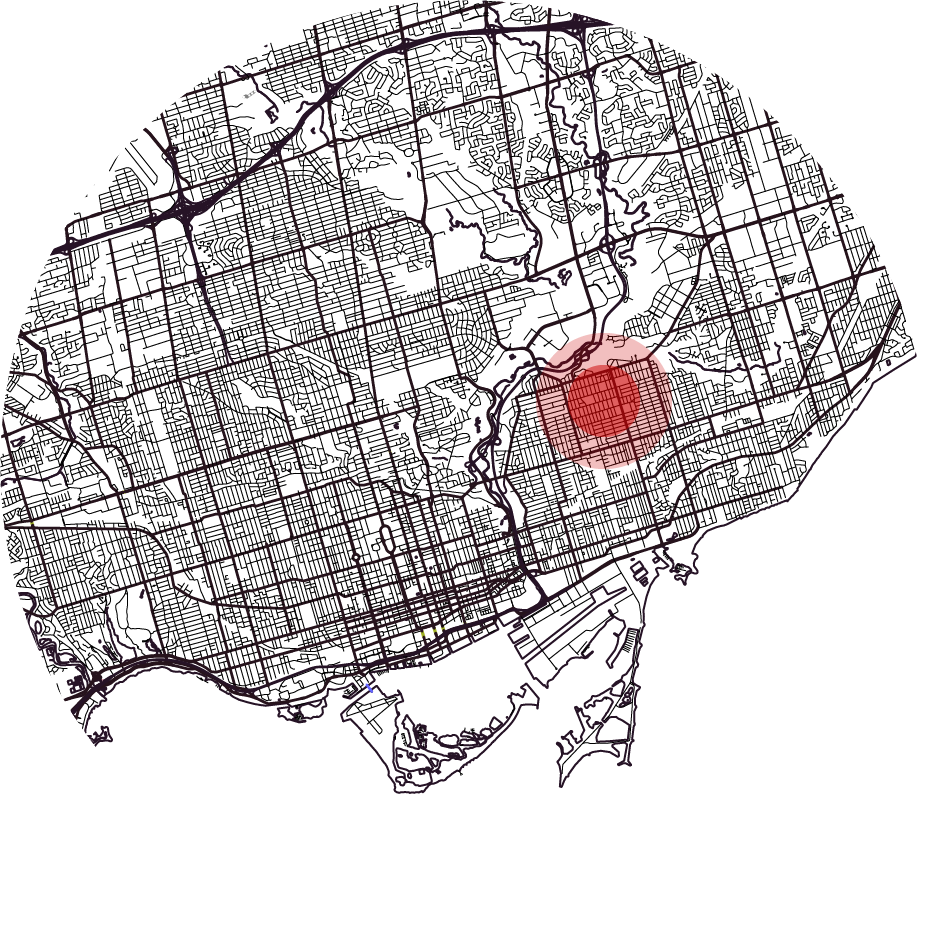
One of the most compelling applications of MLD is using it to observe the characteristics and behaviours of visitors at a specific location. In our app, we offer the ability to draw geofences and pull Visitor Reports on most* major properties or pieces of real estate in Canada.

Visitor report map graphic showing trade area parameter


Visitor Reports provide important insights for:

TRADE AREA CAPTURE RATE

Identifying where a visitor comes from, how far they've travelled, and the origin of their location.

TRADE AREA PROFILE DEVELOPMENT

Understand the demographic characteristics of visitors (based on clusters of visitors) such as income, education, age, and geosocial segmentation.

PREDICTIVE MODELLING

MLD can be used to help to predict performance by looking at mobile data activity volumes within a given area around current and existing sites, removing the activity directly at the existing sites (200 m buffer minus 30 m buffer, depending on footprint size).

Or, understand the shared traffic percentage by detecting the percentage of people driving by an event location (new potential site) and target location (existing site with the potential to be cannibalized).

COMPARATIVE ACTIVITY & TRENDS OVERTIME

Identify what areas are seeing more activity than others. How do these trends change over time?

* PiinPoint outlines some best practices when it comes to generating geofences. For more information, please see the Visitor Reporting section in our User Guide.
Visitor Reports can be created in a few simple steps:
  1. Create a Mobile Data Layer
  2. Draw your Geofence
  3. Create the Visitor Report
Location Report

PIINPOINT METHODOLOGY:
Turning Raw MLD Observations into Identified Visitors

STEP 1. Data Receipt and Storage
Our data provider, Veraset, continually collects MLD from their partners. This  data comes in the form of  mobile device "pings," or information packets passed along when the device communicates with a server. The key information provided in a ping are: device ID, time stamp, location (latitude, and longitude) as well as a measure of location accuracy. Veraset collects and consolidates data daily from their providers and makes the data available to PiinPoint.
STEP 2. Data Cleaning and Validation
PiinPoint then hosts and organizes the raw data in-house. At the start of each month (after leaving a 5-10 day lag time, enough time for Veraset to collect and consolidate data from their providers), we develop a new data table for all observations over the past month. Observation data is imported, cleaned, indexed, and organized to match the correct dates for the month, in a format that can easily be consumed by the PiinPoint application and its Visitor Reports.
STEP 3. Monitoring the Data for Sample Size Changes
From one month to the next, the size of raw observation data from Veraset can fluctuate, and must be accounted for. Fluctuation can be due to a number of factors, from the number of pings unique devices have, to new 3rd party app partners which Veraset brings on, to location sharing privacy changes which impact location sharing apps. PiinPoint ensures observations which become estimates in the app are accurate.
STEP 4. Scaling and Extrapolation
One of the most important concepts to keep in mind when using Mobile Location Data is that the raw data itself is only a sampling of the population. Therefore, to use MLD in its Visitor Reports, PiinPoint applies a sampling factor, resulting in the data served in the app to users as an extrapolation, intended to represent the full Canadian population.
To understand the proportion of the population that we are working with, each month we do cross-validation on an external dataset of home locations from Veraset, separate from their raw observation data.
Distribution of home locations from Veraset across Southern Ontario. Veraset home locations are very highly correlated to the distribution of population from the census at the CSD level (R² = 0.98)
Image 1. Distribution of home locations from Veraset across Southern Ontario. Veraset home locations are very highly correlated to the distribution of population from the census at the CSD level (R² = 0.98).

The number of home locations across the country are taken to understand the percent of the population that is in the data, and the difference is used to extrapolate the sample to an estimated total volume based on the population size and sample of the province.

Within the raw observation data, there are devices which do not have consistent enough data to identify home locations for. These devices often have very few pings and are not as consistent in the raw dataset. We make sure to filter these out, ensuring that each device in our database is taken into account in the scaling factors, and that each device sends enough data to be traceable to a home location (and to the different locations they visit throughout each day). 

We have further tested this process to see how this would affect the number of visits, by looking at a sample of over 1000 sample locations. Through this extrapolation exercise, we have found that on average 95% of visits are retained  after filtering for devices with home locations.
Above is a histogram of the percentage of retained visits after filtering out devices without home locations among 1000+ locations. This test is considered a success as we do not see a dramatic drop in legitimate visits and can be confident that the values we see in-app match our scaling factors accurately.
Image 2. Above is a histogram of the percentage of retained visits after filtering out devices without home locations among 1000+ locations. This test is considered a success as we do not see a dramatic drop in legitimate visits and can be confident that the values we see in-app match our scaling factors accurately.

STEP 5. Output Validation & Deployment
Each new finalized monthly data table is reviewed before deployment into the application. Trends are also monitored against federally reported statistics through the Government of Canada on retail spending and activity, for added measure that results are intuitive across periods of time, prior to being released.

USING REAL WORLD DATA TO DETERMINE ACCURACY

Additional accuracy measures can be developed against MLD sources to determine how accurate Visitor Counts are compared to “real-world data''. Real-world data traditionally comes from internal-to-the-client sources such as; looking at customer spending or location data, people-counting technology in stores, survey samples at checkout or in-store, or loyalty program data.

While these datasets have the potential to improve accuracy of total visit counts, unique visit counts, trends over time, and trade area capture rates, they are most applicable to a subset of places or properties. Applicable property geofences would need to follow the best practices PiinPoint outlines in our User Guide.
We do not recommend using these comparative datasets to validate activity data at larger or more complex properties, such as a shopping mall or multi-storey building. In these cases, the analysis often results in comparing apples against oranges, as other interactions often get captured in the Mobile Location Data such as subways stops, underground transit, commercial uses, etc., which would not be captured in the physical technology or process to measure activity. As a result, the two datasets - PiinPoint Visitor Report visits versus people-counting technology visits - we would expect to have different results.

PiinPoint is happy to incorporate real-world datasets provided by our clients to enhance our predictive methodologies. 

APPLYING MOBILE LOCATION DATA TO LOCATION ANALYTICS

PiinPoint’s Visitor Reports can help support business challenges for a myriad of retail departments. MLD really shines when it is aggregated across time to understand the capture area of a location, to describe the characteristics of people who visit there, their cross-shopping behaviours, or when observed from a high-level over time to understand changes to visits due to seasonality.

To learn more about best practices for applying the data for Mobile Location, check out our Mobile Location Data User Guide.

MLD is a highly powerful, yet very nuanced dataset used in location intelligence.

PiinPoint is committed to being an educational partner to help our customers interpret MLD, learn its nuances, and develop a strong understanding of the dataset and its best applications to your business questions
.

Want to learn how MLD can grow your location intelligence strategy?

Contact us
// EMAIL DOMAINS TO BLOCK